Print reports with AI, for PaperCut MF

Ask for the print report you need. AI builds it.

ecoAI Reports installs on your PaperCut MF server with four reports ready on day one. Need something else? Describe it in plain words: Report Studio writes the report with AI and shows it with your own data before anything is saved.

Your printing data never leaves your server.

Report Studio “Show this chart as lines instead of bars.”
becomes
Private by design

Your server does the work. Your data stays there.

ecoAI Reports lives on the same server as PaperCut MF. The data is stored there, the reports are computed there, and that is where it all stays.

Reports run on your serverThe panel, the reports and years of history live on the PaperCut server. They load and work without internet.
The AI never sees your dataReport Studio works with the report's design and with sample data. Your jobs, users and costs are not sent to it.
Check every change with your real dataThe proposed change is drawn with your data, in your browser and from your server, before you apply it.

What you type in the chat does travel, so the change can be written: keep names and figures out of it.

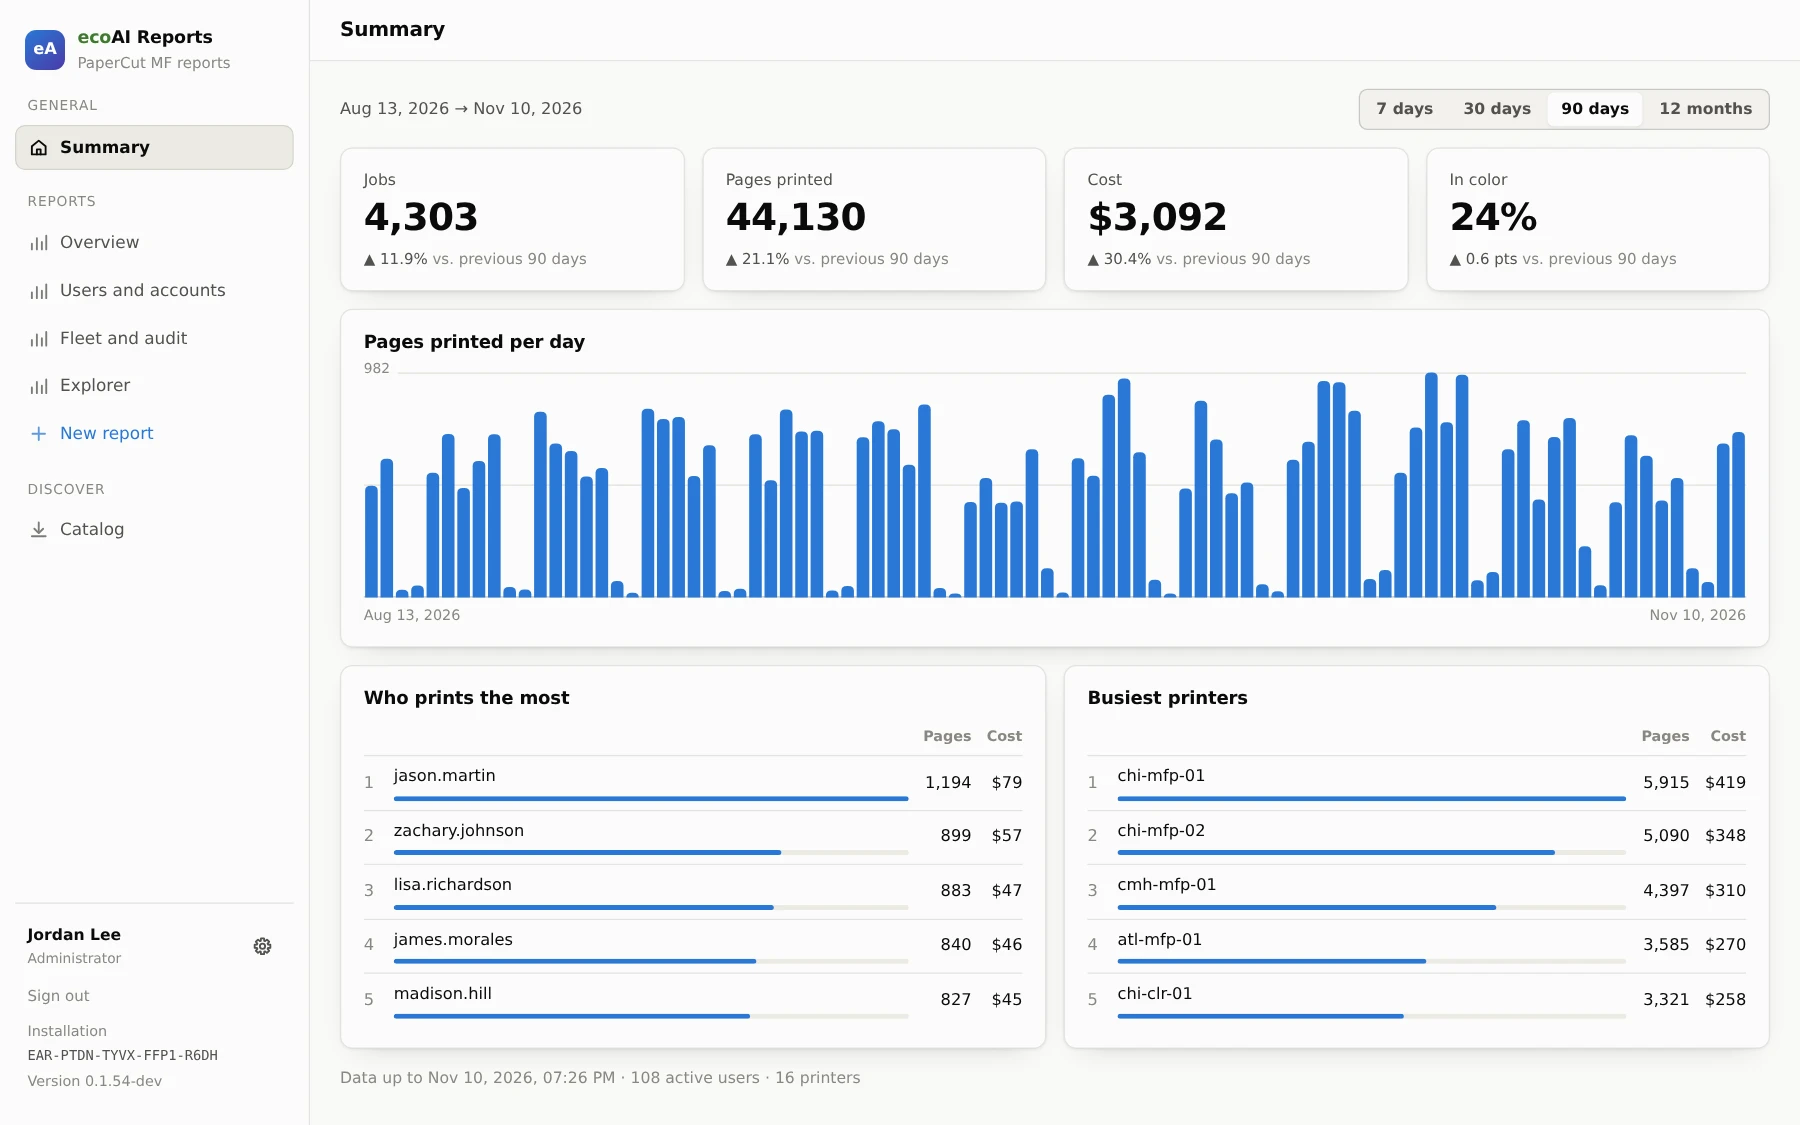
The ecoAI Reports Summary for the last 90 days: 4,303 jobs, 44,130 pages, $3,092 in cost and 24% in color, a daily bar chart of pages printed, and the top five users and printers.

The Summary, the first screen after sign-in. Every figure on it is computed on the PaperCut server itself.

Four reports, installed with the product

Ready on day one

They read the same data PaperCut already exports, so they fill in as soon as the first job is printed. No templates to build, no spreadsheets to merge.

Printing overview

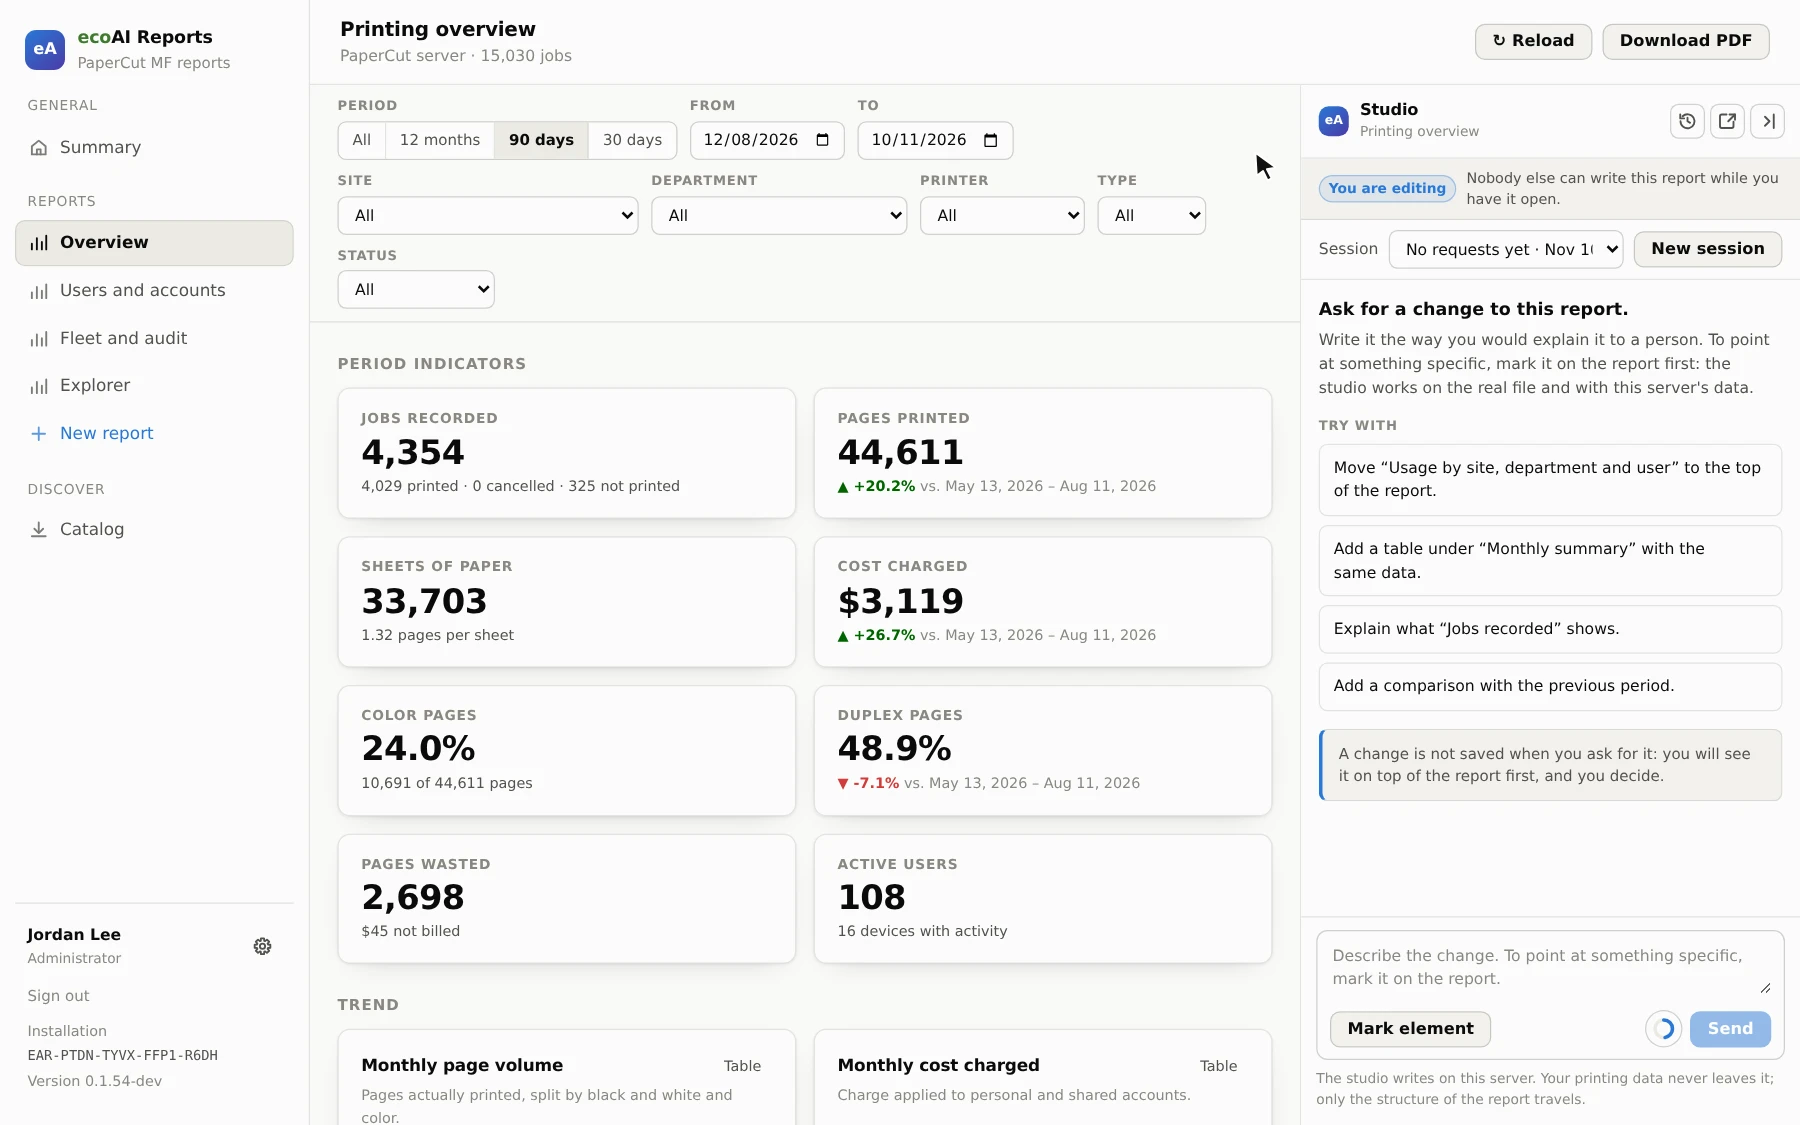
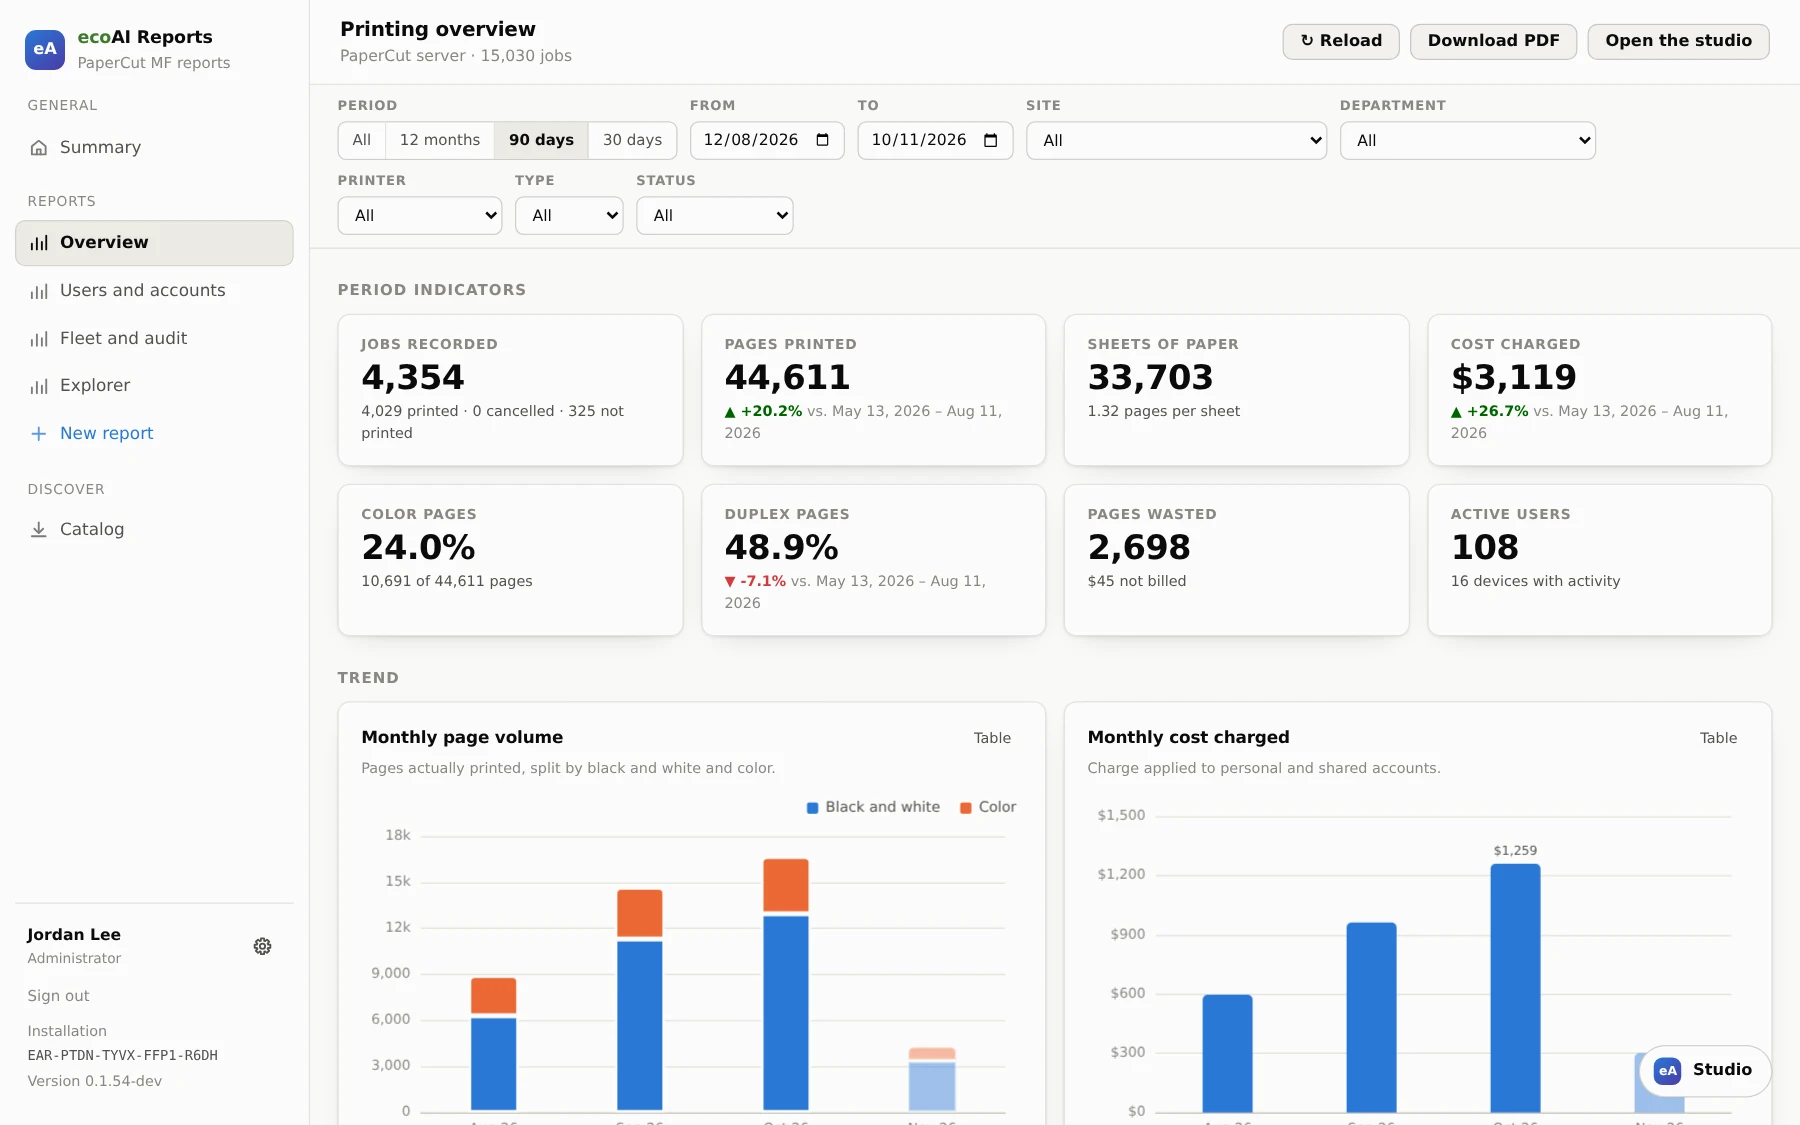
Eight figures for the period, then monthly volume and cost, usage by site, department and person, paper sizes, duplex adoption and the busiest devices.

  • Waste you can see. Pages that went unprinted, and the cost they would have carried.
  • Color and duplex share across all pages, the two numbers most print policies are built on.
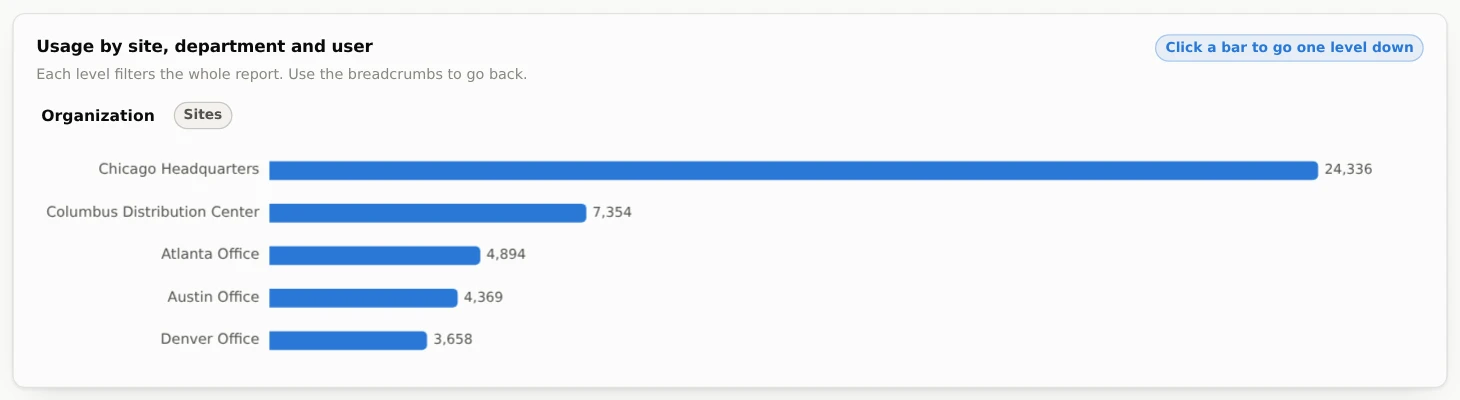
  • Click a bar to go down a level, from the whole organization to one site, one department, one person.
The Printing overview report inside the ecoAI Reports panel: filter bar, eight period indicators and monthly charts of page volume and cost.
Printing overview

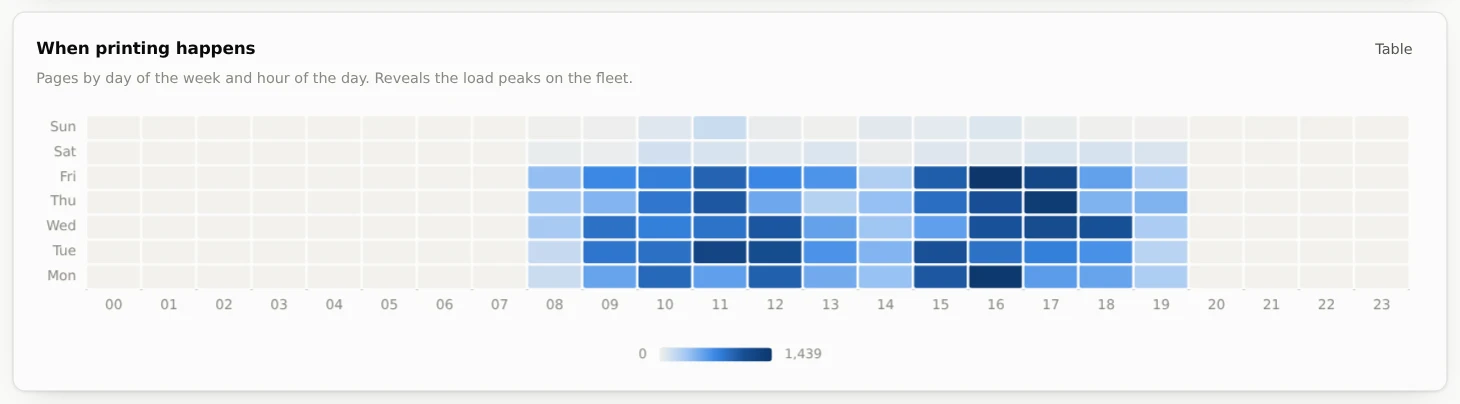
When printing happens

Pages by weekday and hour. Load peaks on the fleet show up at a glance, and so do the hours nobody prints.

Heat map of pages printed by day of the week and hour, busiest on weekdays between 8:00 and 19:00.
Users and accounts

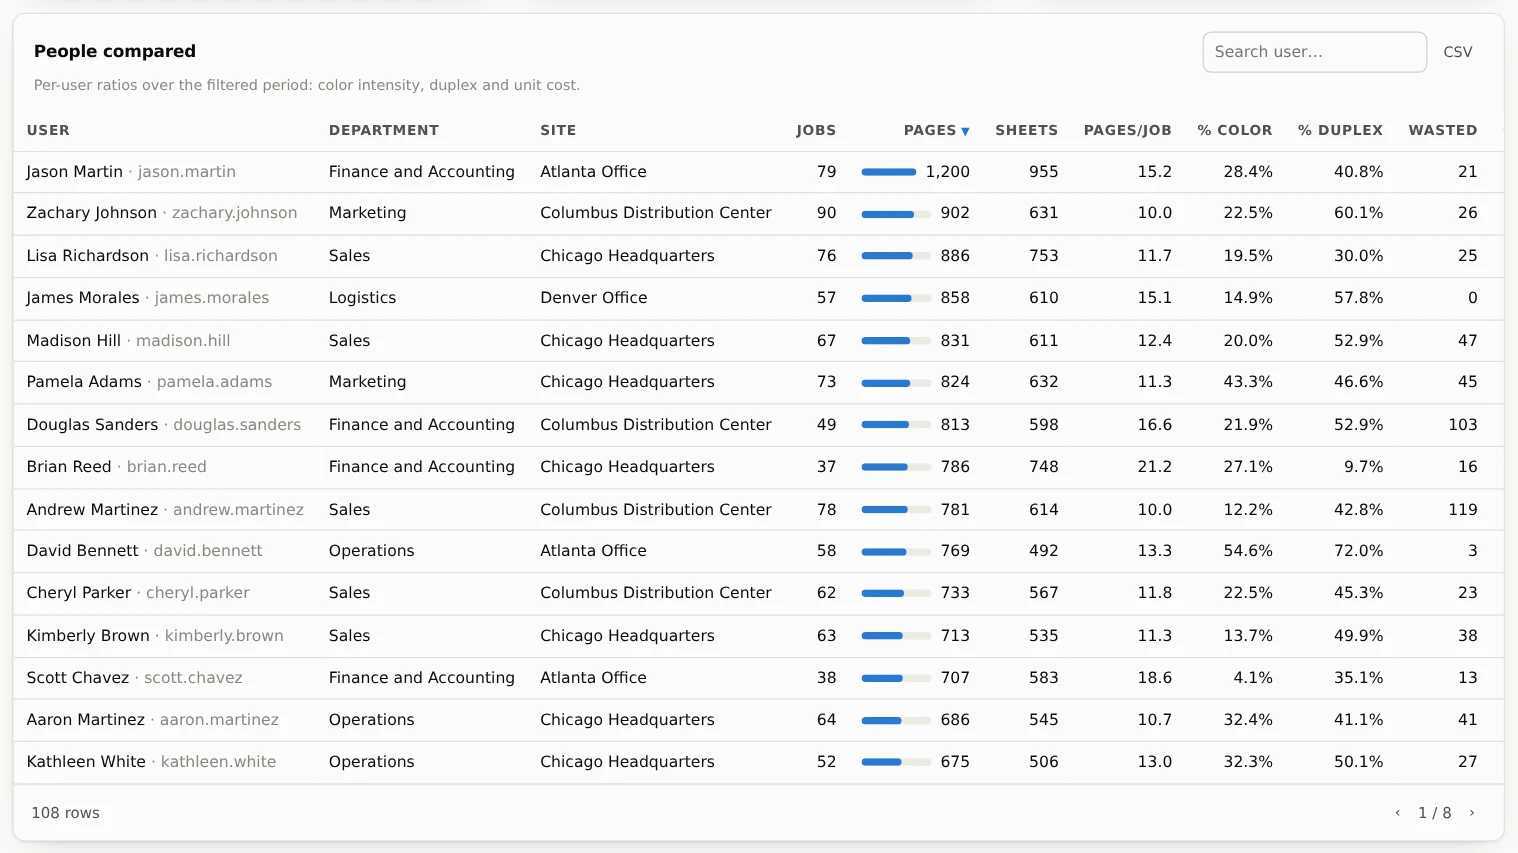
People compared

Every user with department, site, jobs, pages, sheets and pages per job. Search, sort, and export to CSV.

Sortable table of users with department, site, jobs, pages and sheets, with a search box and a CSV button.
Explorer

Go as deep as you want

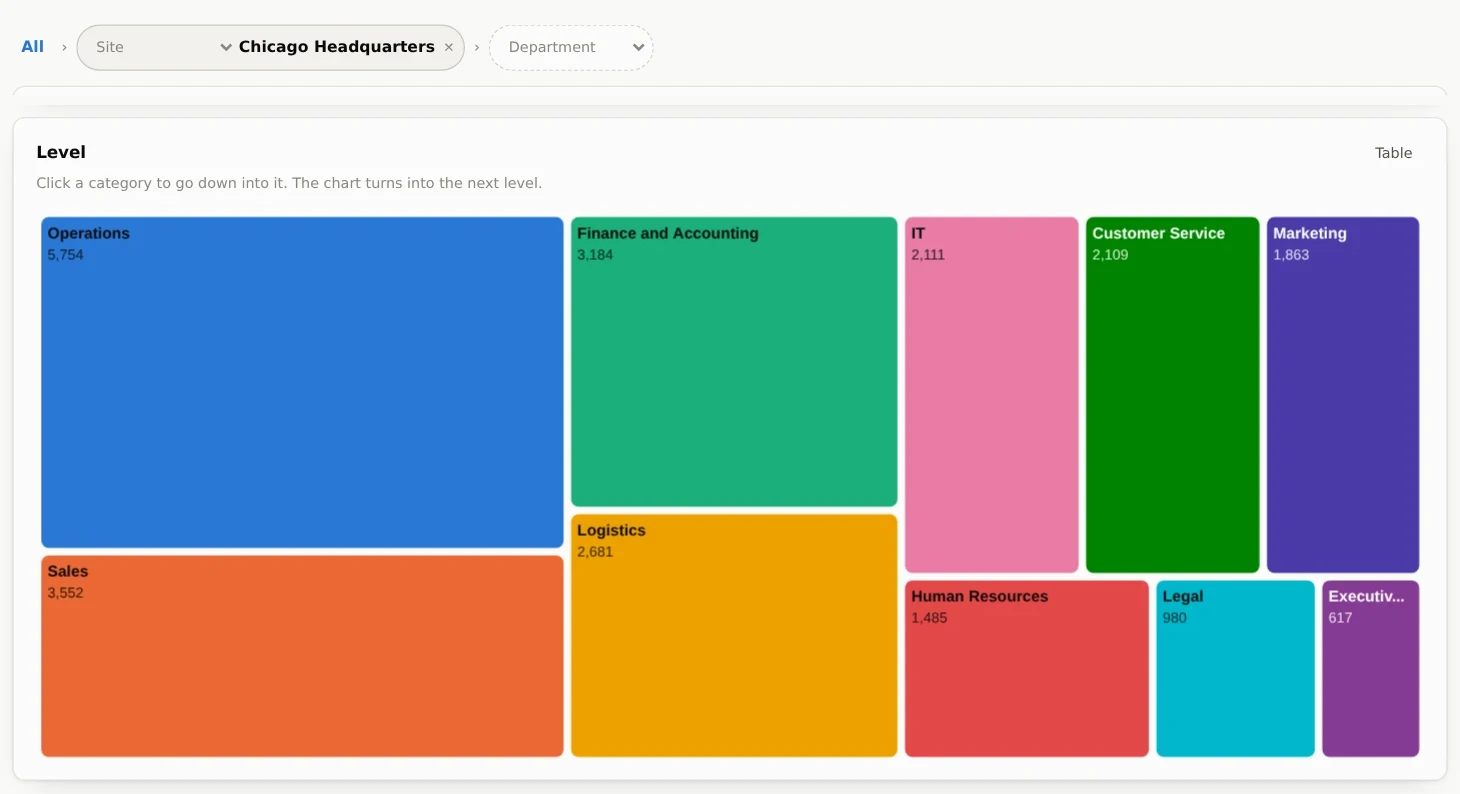
Pick a dimension, click a block, pick the next one. Site, then department, then person, then printer, in any order.

The Explorer opened one level down: the path All › Site: Chicago Headquarters › Department, and a treemap of pages by department, led by Operations with 5,754.
Fleet and audit

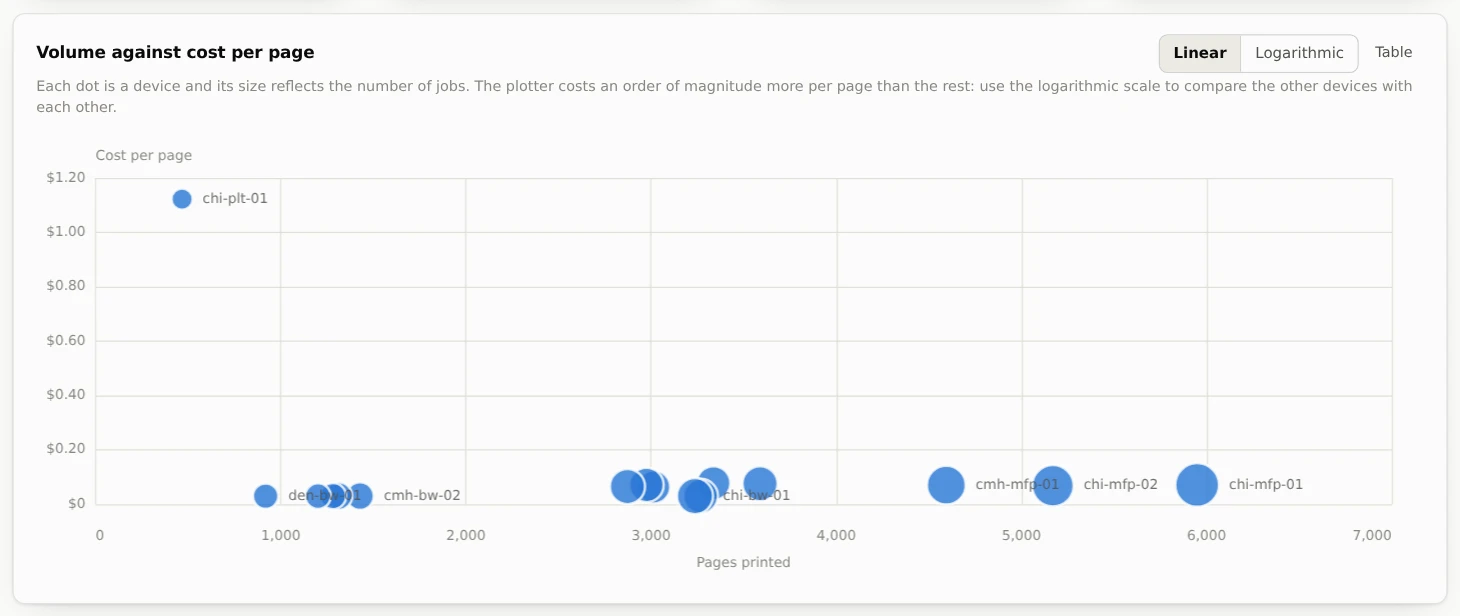
Volume against cost per page

Each dot is a device, sized by its jobs. The expensive ones and the idle ones stand out, and the inventory below lists every device.

Scatter chart of devices by pages printed and cost per page; the plotter sits far above the rest.

Filter once, every chart follows

One filter bar on top of every report

Change the period or pick a department and the whole page answers for that slice, figures and charts alike.

Period From · To Site Department Printer Type Status
  • Any chart becomes a table with one click, for when the exact number matters.
  • Ranges of years stay fast. The browser receives only the period you're looking at, not the whole history.
Bar chart of pages by site, with a hint to click a bar to go one level down.
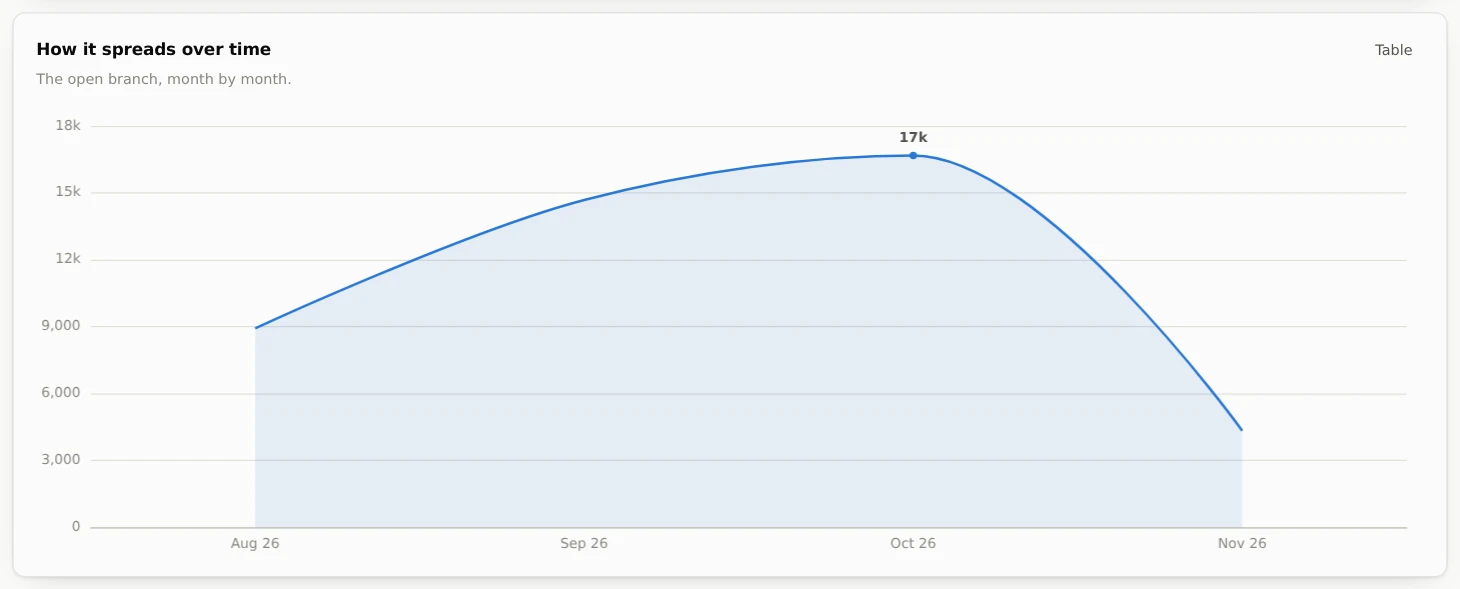
Area chart of pages per month over the last 90 days, peaking in October.
Report Studio

Need it different? Ask for it.

Open the studio beside any report and describe the change in plain words. It writes the change, runs it on your own data, and shows you the result before anything is saved.

Report Studio open beside the Printing overview: a welcome text, suggested requests, and the note that printing data never leaves the server.

The studio opens beside the report, with suggestions to start from.

  1. Point at it (optional) Click a chart or a figure on the report. It gets a number you can refer to.
  2. Ask in your own words “Split the monthly volume by site.” “Put cost first.” “Use our company colors.”
  3. See it with your data The changed pieces are labelled Preview on the real report, with this server's numbers.
  4. Apply or keep working Nothing changes for anyone until you apply. Earlier versions are kept, so you can go back.

“The studio writes on this server; only the structure of the report and your request travel.”

  • One editor at a time. While you have a report open in the studio, nobody else can change it.
  • Only administrators edit. Viewers see the finished report and nothing else.
  • Pay for what you use. Studio requests spend tokens your organization buys. They do not expire, and the meter next to Send shows what is left.
  • Your brand. Your logo and colors carry into the panel and into every report.

Start a report from a sentence

New report, written by the studio

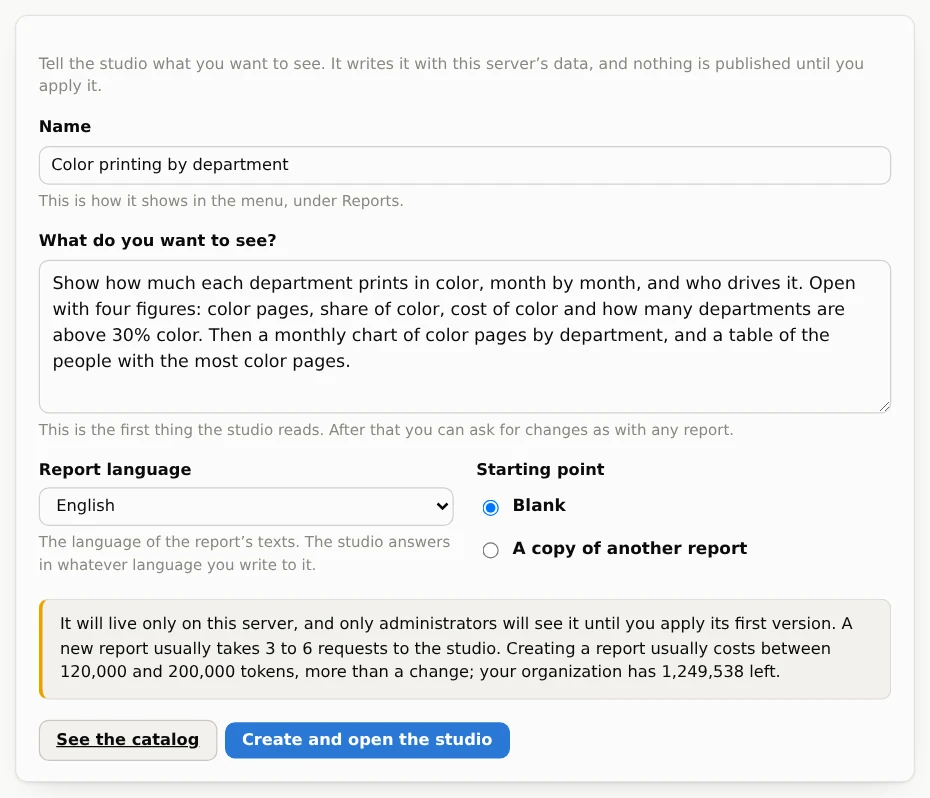
Give it a name and say what you want to see. The studio writes it with this server's data, from a blank page or from a copy of a report you already have.

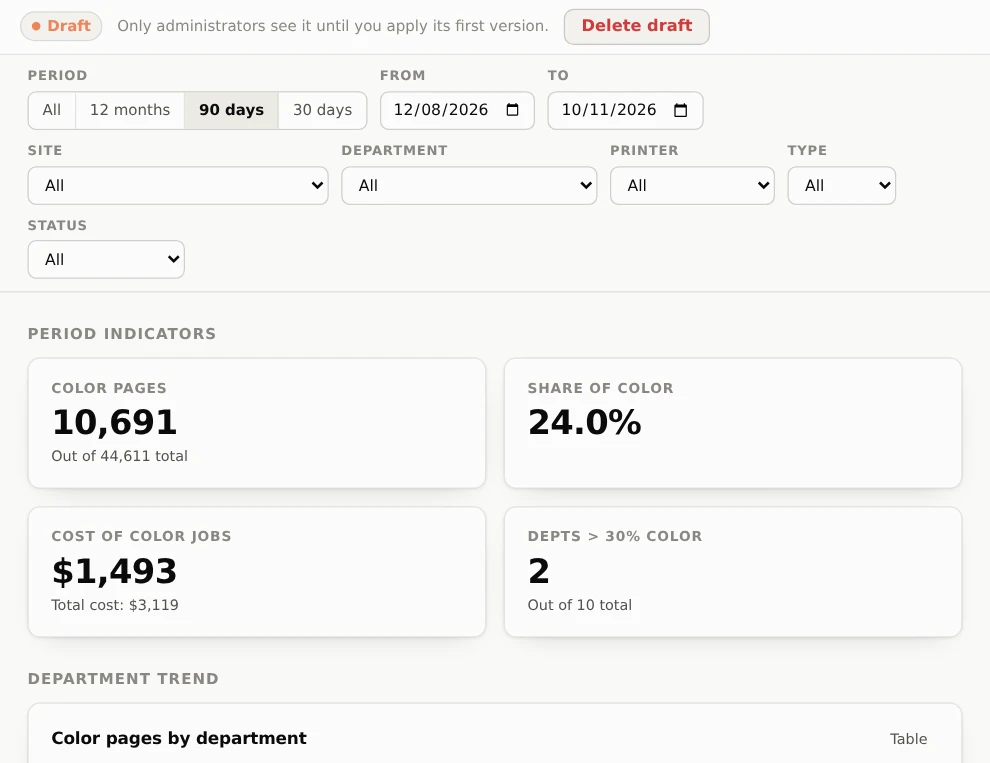
  • A draft until you say so. Only administrators see it, marked Draft in the menu, until you apply its first version.
  • Written in the language you pick, whatever language you use to ask.
  • Then keep asking. After the first version, you change it like any other report.
The New report form: a name, a box describing what to see, the report language and whether to start blank or from a copy.
The new report as a draft: the Draft notice with Delete draft, the filter bar and four figures: 10,691 color pages, 24.0% share of color, $1,493 cost of color jobs and 2 departments above 30% color.

Take it to the meeting

Download PDF, on every report

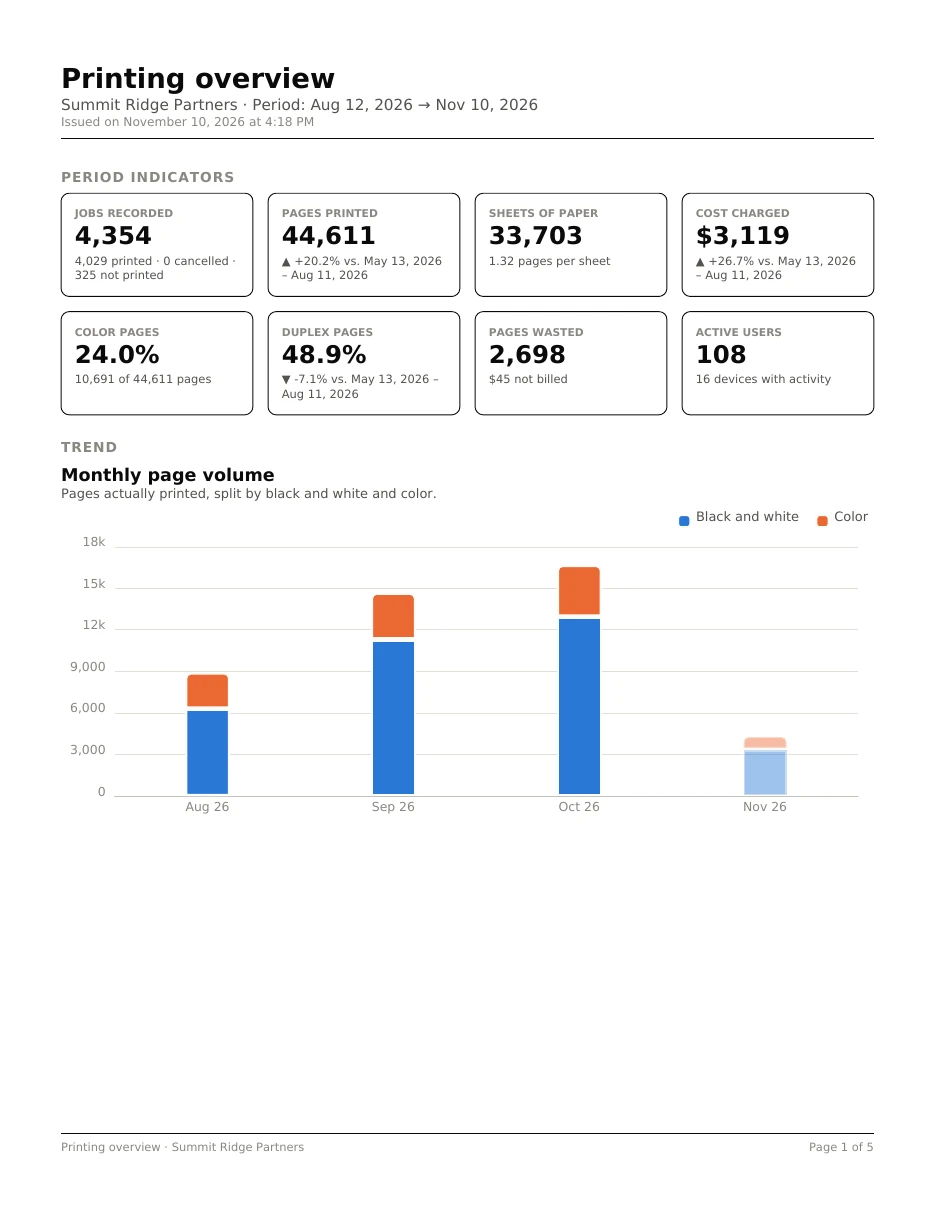
The file states the period it covers, the date it was issued and its page numbers.

  • Charts stay sharp. They are drawn as vectors, so they print clean at any size.
  • Built in your browser from the report on screen. Nothing is sent anywhere to make it.
First page of the Printing overview PDF: title, period, eight indicators and the monthly page volume chart.

Years of printing, not just the last few weeks

History that PaperCut would have deleted

PaperCut's data export cleans up old files on a schedule. ecoAI Reports copies each one as it arrives into its own store on the server, so next year's report can still compare with this year's.

Already running PaperCut for a while? ecoAI Reports can ask it to re-export what it still holds from before the installation, the way the vendor documents it.

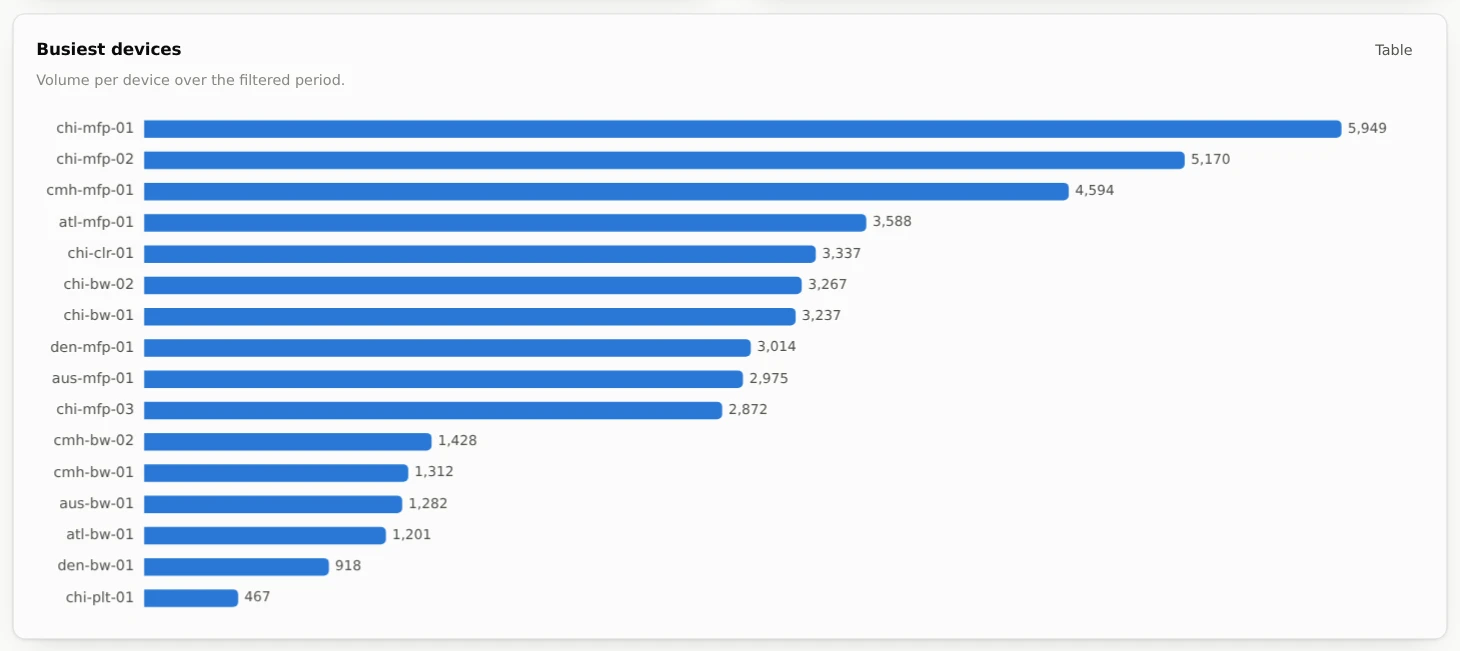
Bar chart of pages per device over the last 90 days, led by chi-mfp-01 with 5,949 pages.

More reports when you need them

A catalog of reports from ecoprintQ, one click to install

Included

The four above

Installed with the product and updated with it.

Free

Extra reports

Install them from the catalog at no cost.

Paid

Specialist reports

Bought once for the whole organization, valid on all its servers.

Made for you

Your own report

Built by ecoprintQ to your brief, reviewed with your own data before it goes live.

Access and encryption

Security

Served from your server

The panel, the reports and their charts all load from the PaperCut server itself. Reports cannot pull scripts or images from the internet.

Encrypted from the first minute

The panel answers over HTTPS with its own certificate, created at install time and limited to this server's names.

Two profiles

Administrators change reports and settings. Viewers read reports. Every request is checked on the server, not only hidden in the menu.

Sign in with PaperCut, if you want

The PaperCut admin can sign in with the same username and password, and the PaperCut users you invite with theirs. ecoAI Reports' own accounts work just as well.

Up and running in an afternoon

A system service next to PaperCut MF, back on its own after a restart

  1. Step 1

    Run the installer

    On the PaperCut MF server: the .exe on Windows, or the .sh package on Linux. ecoprintQ sends you the link.

  2. Step 2

    Load the integration

    The installer configures PaperCut's data export. You press Load Integrations once in PaperCut's admin portal, under Reports › Data Integrations.

  3. Step 3

    Open the panel

    Browse to https://your-server:8711 and sign in. The reports fill in as PaperCut exports.
See it with your own PaperCut data.

Ask ecoprintQ for a demo, or for your installer link.

Talk to ecoprintQ